
Market analysis is a crucial component of investment decision-making, providing valuable insights into the financial markets. It involves examining various factors and indicators to understand market trends and predict future price movements. There are two primary methods used in market analysis: fundamental analysis and technical analysis. In this article, we will explore the differences between these two approaches and their respective merits.
What is Market Analysis?
Market analysis is the process of evaluating the current and historical data of financial markets to determine their future direction. It involves studying various factors such as economic indicators, company financials, market trends, and investor sentiment. By analyzing these factors, investors and traders aim to make informed decisions about buying, selling, or holding assets.
Market analysis is the process of evaluating and studying the current and historical data of financial markets to gain insights into their behavior and make informed decisions. It involves examining various factors, such as economic indicators, market trends, investor sentiment, and industry analysis.
The goal of market analysis is to understand the dynamics of the market, identify potential opportunities and risks, and predict future price movements. By analyzing and interpreting this information, individuals and organizations can develop strategies, allocate resources, and make investment decisions based on a thorough understanding of the market conditions and trends.
The Importance of Market Analysis
Market analysis plays a crucial role in investment decision-making for several reasons. Firstly, it provides insights into the overall market conditions and trends, helping investors identify potential opportunities and risks. Additionally, it assists in understanding the intrinsic value of an asset, aiding in the determination of its fair price. Moreover, market analysis helps investors develop strategies based on their risk appetite and investment goals.
Fundamental Analysis
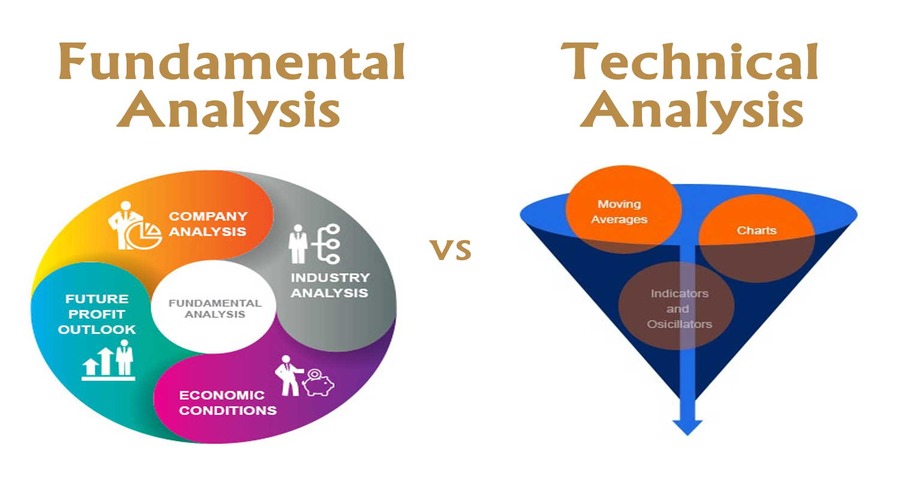
Fundamental analysis is an approach that focuses on evaluating the intrinsic value of an asset. It involves studying the underlying factors that can influence the asset’s price, such as financial statements, industry trends, and macroeconomic indicators.
Definition and Purpose
Fundamental analysis aims to determine the true value of an asset by analyzing its fundamental factors. This method considers both qualitative and quantitative factors to assess the financial health and growth prospects of a company or the overall economy.
Factors Considered in Fundamental Analysis
Fundamental analysis considers various factors, including:
- Financial statements (income statement, balance sheet, cash flow statement)
- Revenue and earnings growth
- Profitability ratios (gross profit margin, operating margin, net profit margin)
- Debt levels and leverage ratios
- Industry analysis and competitive landscape
- Management quality and corporate governance
Tools and Methods Used
Fundamental analysis utilizes a range of tools and methods, including:
- Financial ratio analysis
- Discounted cash flow (DCF) analysis
- Comparable company analysis
- Industry and sector analysis
- Qualitative assessment of management and competitive advantage
Technical Analysis
Technical analysis, on the other hand, focuses on studying historical price and volume data of an asset to predict future price movements. It is based on the assumption that historical price patterns and trends can help forecast future market behavior.
Definition and Purpose
Technical analysis aims to identify patterns, trends, and support/resistance levels in price charts to predict future price movements. It relies on the belief that historical price and volume data can provide insights into market psychology and supply-demand dynamics.
Key Principles of Technical Analysis
Technical analysis is guided by several key principles, including:
- Price follows trends: The price of an asset tends to move in trends, either upward (bullish) or downward (bearish).
- Support and resistance levels: Certain price levels act as barriers, where the asset’s price tends to bounce off or reverse direction.
- Chart patterns: Specific formations in price charts, such as triangles, head and shoulders, or double tops/bottoms, can indicate potential future price movements.
- Indicators: Technical analysis employs a wide range of indicators, such as moving averages, oscillators, and volume indicators, to confirm or generate trading signals.
Tools and Indicators Used
Technical analysts use various tools and indicators to analyze price charts, including:
- Moving averages (simple moving average, exponential moving average)
- Relative strength index (RSI)
- Moving average convergence divergence (MACD)
- Bollinger Bands
- Fibonacci retracements and extensions
Fundamental vs. Technical Analysis: Key Differences
While both fundamental and technical analysis aim to understand market behavior, they differ in their approach, time horizon, data sources, and strengths and limitations.
Focus and Approach
Fundamental analysis focuses on evaluating the intrinsic value of an asset by examining its financials, industry trends, and other qualitative factors. It takes a more holistic approach and aims to determine the asset’s long-term potential.
On the other hand, technical analysis focuses on studying historical price patterns and indicators to predict short-term price movements. It is more concerned with market psychology and identifying entry and exit points for trading.
Time Horizon
Fundamental analysis is typically used by long-term investors who are interested in the overall value and prospects of an asset. It takes into account factors that can influence the asset’s performance over a more extended period, such as economic conditions, industry trends, and company growth prospects.
In contrast, technical analysis is often employed by short-term traders who seek to profit from short-term price fluctuations. It focuses on analyzing price charts and indicators to identify short-term trading opportunities.
Data and Information Sources
Fundamental analysis relies on a wide range of data sources, including financial statements, economic reports, industry research, and company announcements. Analysts interpret this data to assess the financial health and growth potential of an asset.
Technical analysis primarily uses historical price and volume data. Analysts study price charts, patterns, and indicators to identify trends and potential price reversals. While some technical analysts may consider external factors, such as news events, the main focus is on the price and volume data.
Strengths and Limitations
Fundamental analysis has several strengths, such as its ability to identify long-term value and growth potential. It helps investors make informed decisions based on a deep understanding of an asset’s fundamentals. However, fundamental analysis can be time-consuming and subjective, as interpretations of qualitative factors can vary.
Technical analysis excels in its ability to provide short-term trading signals and identify entry and exit points. It is more objective and relies on historical data, which is readily available. However, technical analysis has limitations in predicting major market events or changes in fundamentals.
Combining Fundamental and Technical Analysis
Many market participants utilize a combination of fundamental and technical analysis to make investment decisions. By combining both approaches, investors can gain a more comprehensive understanding of the market and increase their chances of success.
Fundamental analysis provides a long-term perspective and helps identify undervalued or overvalued assets based on their intrinsic value. Technical analysis, on the other hand, assists in timing entry and exit points and identifying short-term trading opportunities within the broader fundamental context.
By integrating these two methods, investors can make more informed and well-rounded investment decisions, taking advantage of both fundamental trends and short-term price movements.
Conclusion
Market analysis is a vital tool for investors and traders, helping them navigate the complex world of financial markets. Fundamental and technical analysis are two primary approaches used to understand market behavior and make investment decisions.
Fundamental analysis focuses on evaluating the intrinsic value of an asset based on qualitative and quantitative factors. It provides insights into long-term prospects and the financial health of companies or economies.
Technical analysis, on the other hand, studies historical price and volume data to predict short-term price movements. It helps traders identify trends, support/resistance levels, and potential entry and exit points.
Both approaches have their strengths and limitations, and combining them can enhance decision-making. Investors can benefit from a holistic understanding of an asset’s fundamentals while taking advantage of short-term trading opportunities.
In conclusion, understanding market analysis and utilizing both fundamental and technical analysis can empower investors to make more informed and profitable investment decisions.
Frequently Asked Questions (FAQs)
- What is the best analysis method for long-term investors?
- Long-term investors often rely on fundamental analysis to assess the intrinsic value and growth potential of an asset. This approach helps them make informed decisions based on the asset’s fundamentals and long-term prospects.
- Can technical analysis be used for all types of assets?
- Yes, technical analysis can be used for various types of assets, including stocks, commodities, currencies, and cryptocurrencies. The principles and indicators used in technical analysis can be applied to analyze price movements in different markets.
- How much historical data is needed for technical analysis?
- The amount of historical data required for technical analysis varies depending on the trading strategy and time frame. In general, analysts look at several years’ worth of data to identify significant trends and patterns. However, shorter-term traders may focus on more recent data.
- Are there any risks associated with relying solely on fundamental analysis?
- Relying solely on fundamental analysis has its risks. Market sentiment and short-term price fluctuations can impact an asset’s performance, even if the fundamentals are strong. Incorporating technical analysis can help investors better time their entry and exit points.
- Can beginners use both fundamental and technical analysis effectively?
- Yes, beginners can use both fundamental and technical analysis effectively by learning and applying the basic principles of each method. It’s important to educate oneself, practice, and gradually refine analysis skills over time. Consulting with experienced professionals can also be beneficial in the learning process.